時間剖析
在本章中,我們將改善 Game of Life 實作的效能。我們將使用時間剖析來指導我們的努力。
在繼續之前,請熟悉可用的 Rust 和 WebAssembly 程式碼時間剖析工具。
使用 window.performance.now 函式建立一個每秒畫面數計時器
在調查如何加速我們 Game of Life 的渲染時,這個 FPS 計時器將很有用。
我們先在 wasm-game-of-life/www/index.js 中新增一個 fps 物件
const fps = new class {
  constructor() {
    this.fps = document.getElementById("fps");
    this.frames = [];
    this.lastFrameTimeStamp = performance.now();
  }

  render() {
    // Convert the delta time since the last frame render into a measure
    // of frames per second.
    const now = performance.now();
    const delta = now - this.lastFrameTimeStamp;
    this.lastFrameTimeStamp = now;
    const fps = 1 / delta * 1000;

    // Save only the latest 100 timings.
    this.frames.push(fps);
    if (this.frames.length > 100) {
      this.frames.shift();
    }

    // Find the max, min, and mean of our 100 latest timings.
    let min = Infinity;
    let max = -Infinity;
    let sum = 0;
    for (let i = 0; i < this.frames.length; i++) {
      sum += this.frames[i];
      min = Math.min(this.frames[i], min);
      max = Math.max(this.frames[i], max);
    }
    let mean = sum / this.frames.length;

    // Render the statistics.
    this.fps.textContent = `
Frames per Second:
         latest = ${Math.round(fps)}
avg of last 100 = ${Math.round(mean)}
min of last 100 = ${Math.round(min)}
max of last 100 = ${Math.round(max)}
`.trim();
  }
};
接著我們在 renderLoop 的每次反覆運算中,呼叫 fps 的 render 函式
const renderLoop = () => {
    fps.render(); //new

    universe.tick();
    drawGrid();
    drawCells();

    animationId = requestAnimationFrame(renderLoop);
};
最後,別忘了在 wasm-game-of-life/www/index.html 中,將 fps 元素新增到 <canvas> 的正上方
<div id="fps"></div>
並新增 CSS 來美化它的格式
#fps {
  white-space: pre;
  font-family: monospace;
}
瞧!更新http://localhost:8080,我們現在有一個 FPS 計數器了!
使用 console.time 和 console.timeEnd 為每個 Universe::tick 計時
要測量每次呼叫 Universe::tick 會花費多長時間,我們可以使用 web-sys Crate 中的 console.time 和 console.timeEnd。
首先,將 web-sys 新增為 wasm-game-of-life/Cargo.toml 的相依性
[dependencies.web-sys]
version = "0.3"
features = [
  "console",
]
由於每次呼叫 console.time 都應該有一個相對應的 console.timeEnd 呼叫,因此將它們同時做成 RAII 型別會比較方便
# #![allow(unused_variables)]
#fn main() {
extern crate web_sys;
use web_sys::console;

pub struct Timer<'a> {
    name: &'a str,
}

impl<'a> Timer<'a> {
    pub fn new(name: &'a str) -> Timer<'a> {
        console::time_with_label(name);
        Timer { name }
    }
}

impl<'a> Drop for Timer<'a> {
    fn drop(&mut self) {
        console::time_end_with_label(self.name);
    }
}
#}
接著,我們可以在方法的頂部新增這個程式片段,計時執行每個 Universe::tick 花費的時間
# #![allow(unused_variables)]
#fn main() {
let _timer = Timer::new("Universe::tick");
#}
呼叫 Universe::tick 花費的時間現在都會記錄在主控台
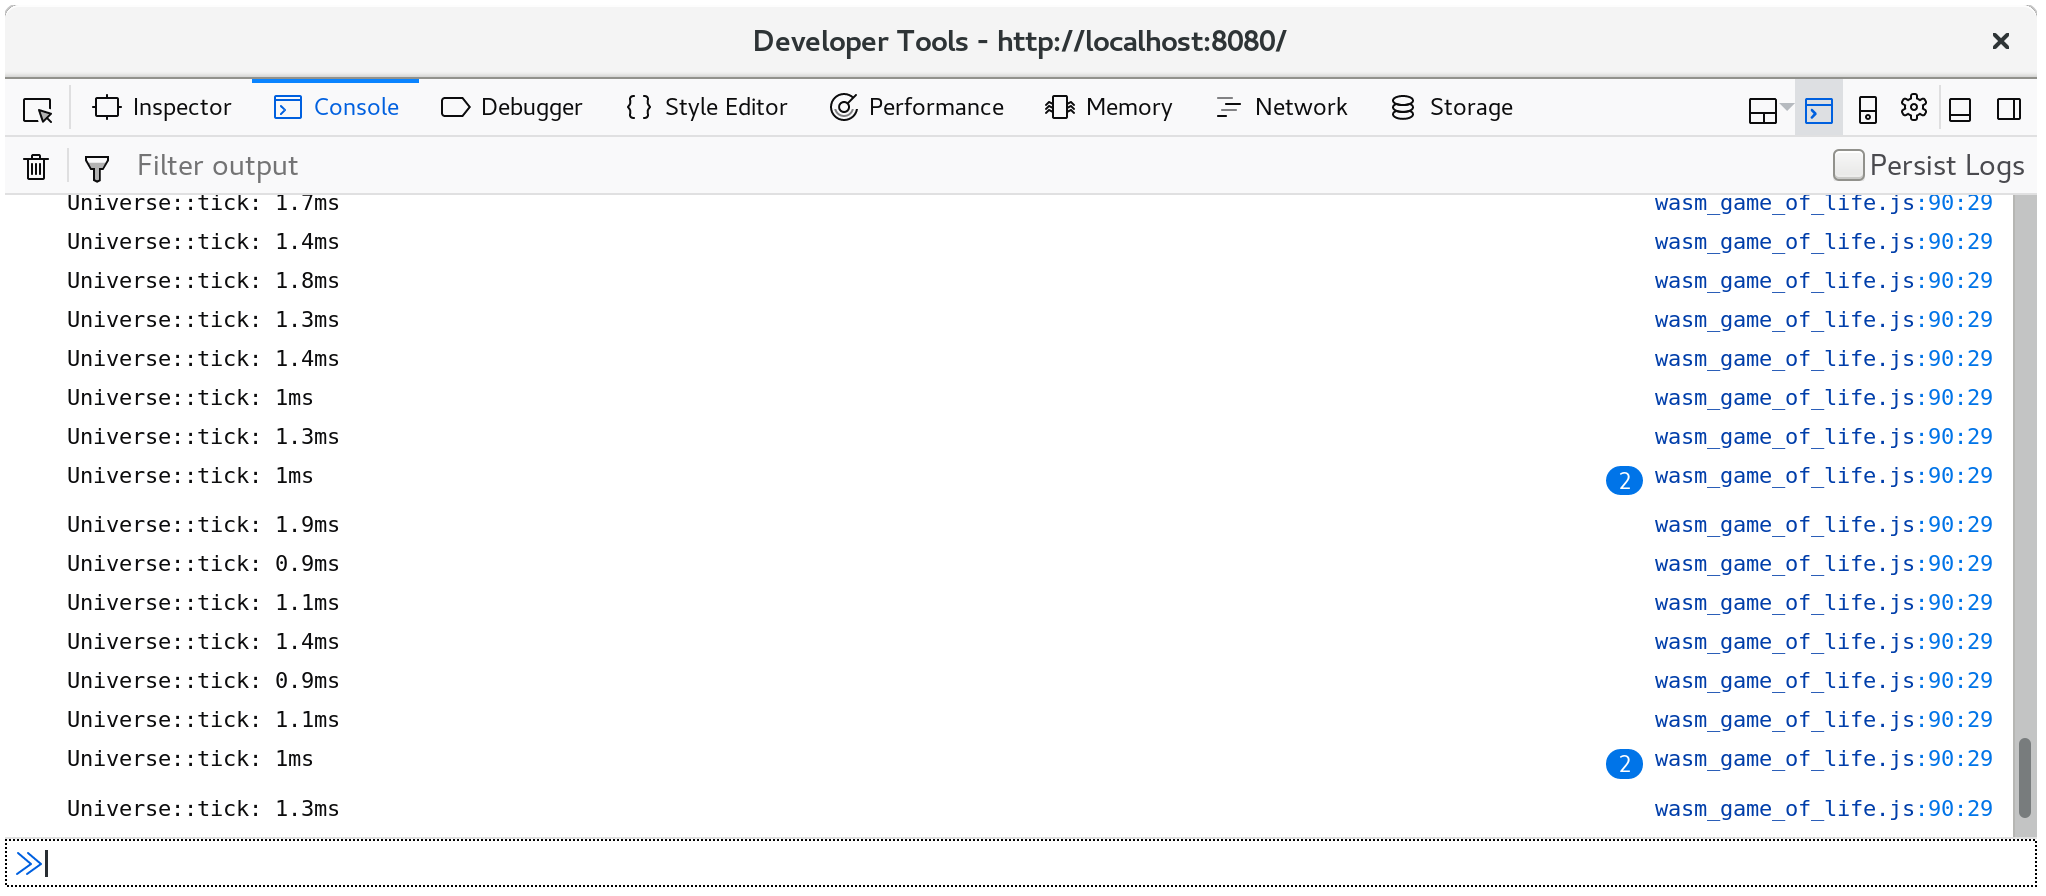
此外,console.time 和 console.timeEnd 會出現在瀏覽器的剖析器的「時間軸」或「瀑布」檢視中
擴展我們的 Game of Life Universe
⚠️ 這個區段使用 Firefox 的螢幕擷圖範例。雖然所有現代瀏覽器都有類似的工具,但在操作不同的開發者工具時可能會有些微細微差別。您提取的剖析資訊基本上會相同,但您看到的檢視和不同工具的名稱可能會有所不同。
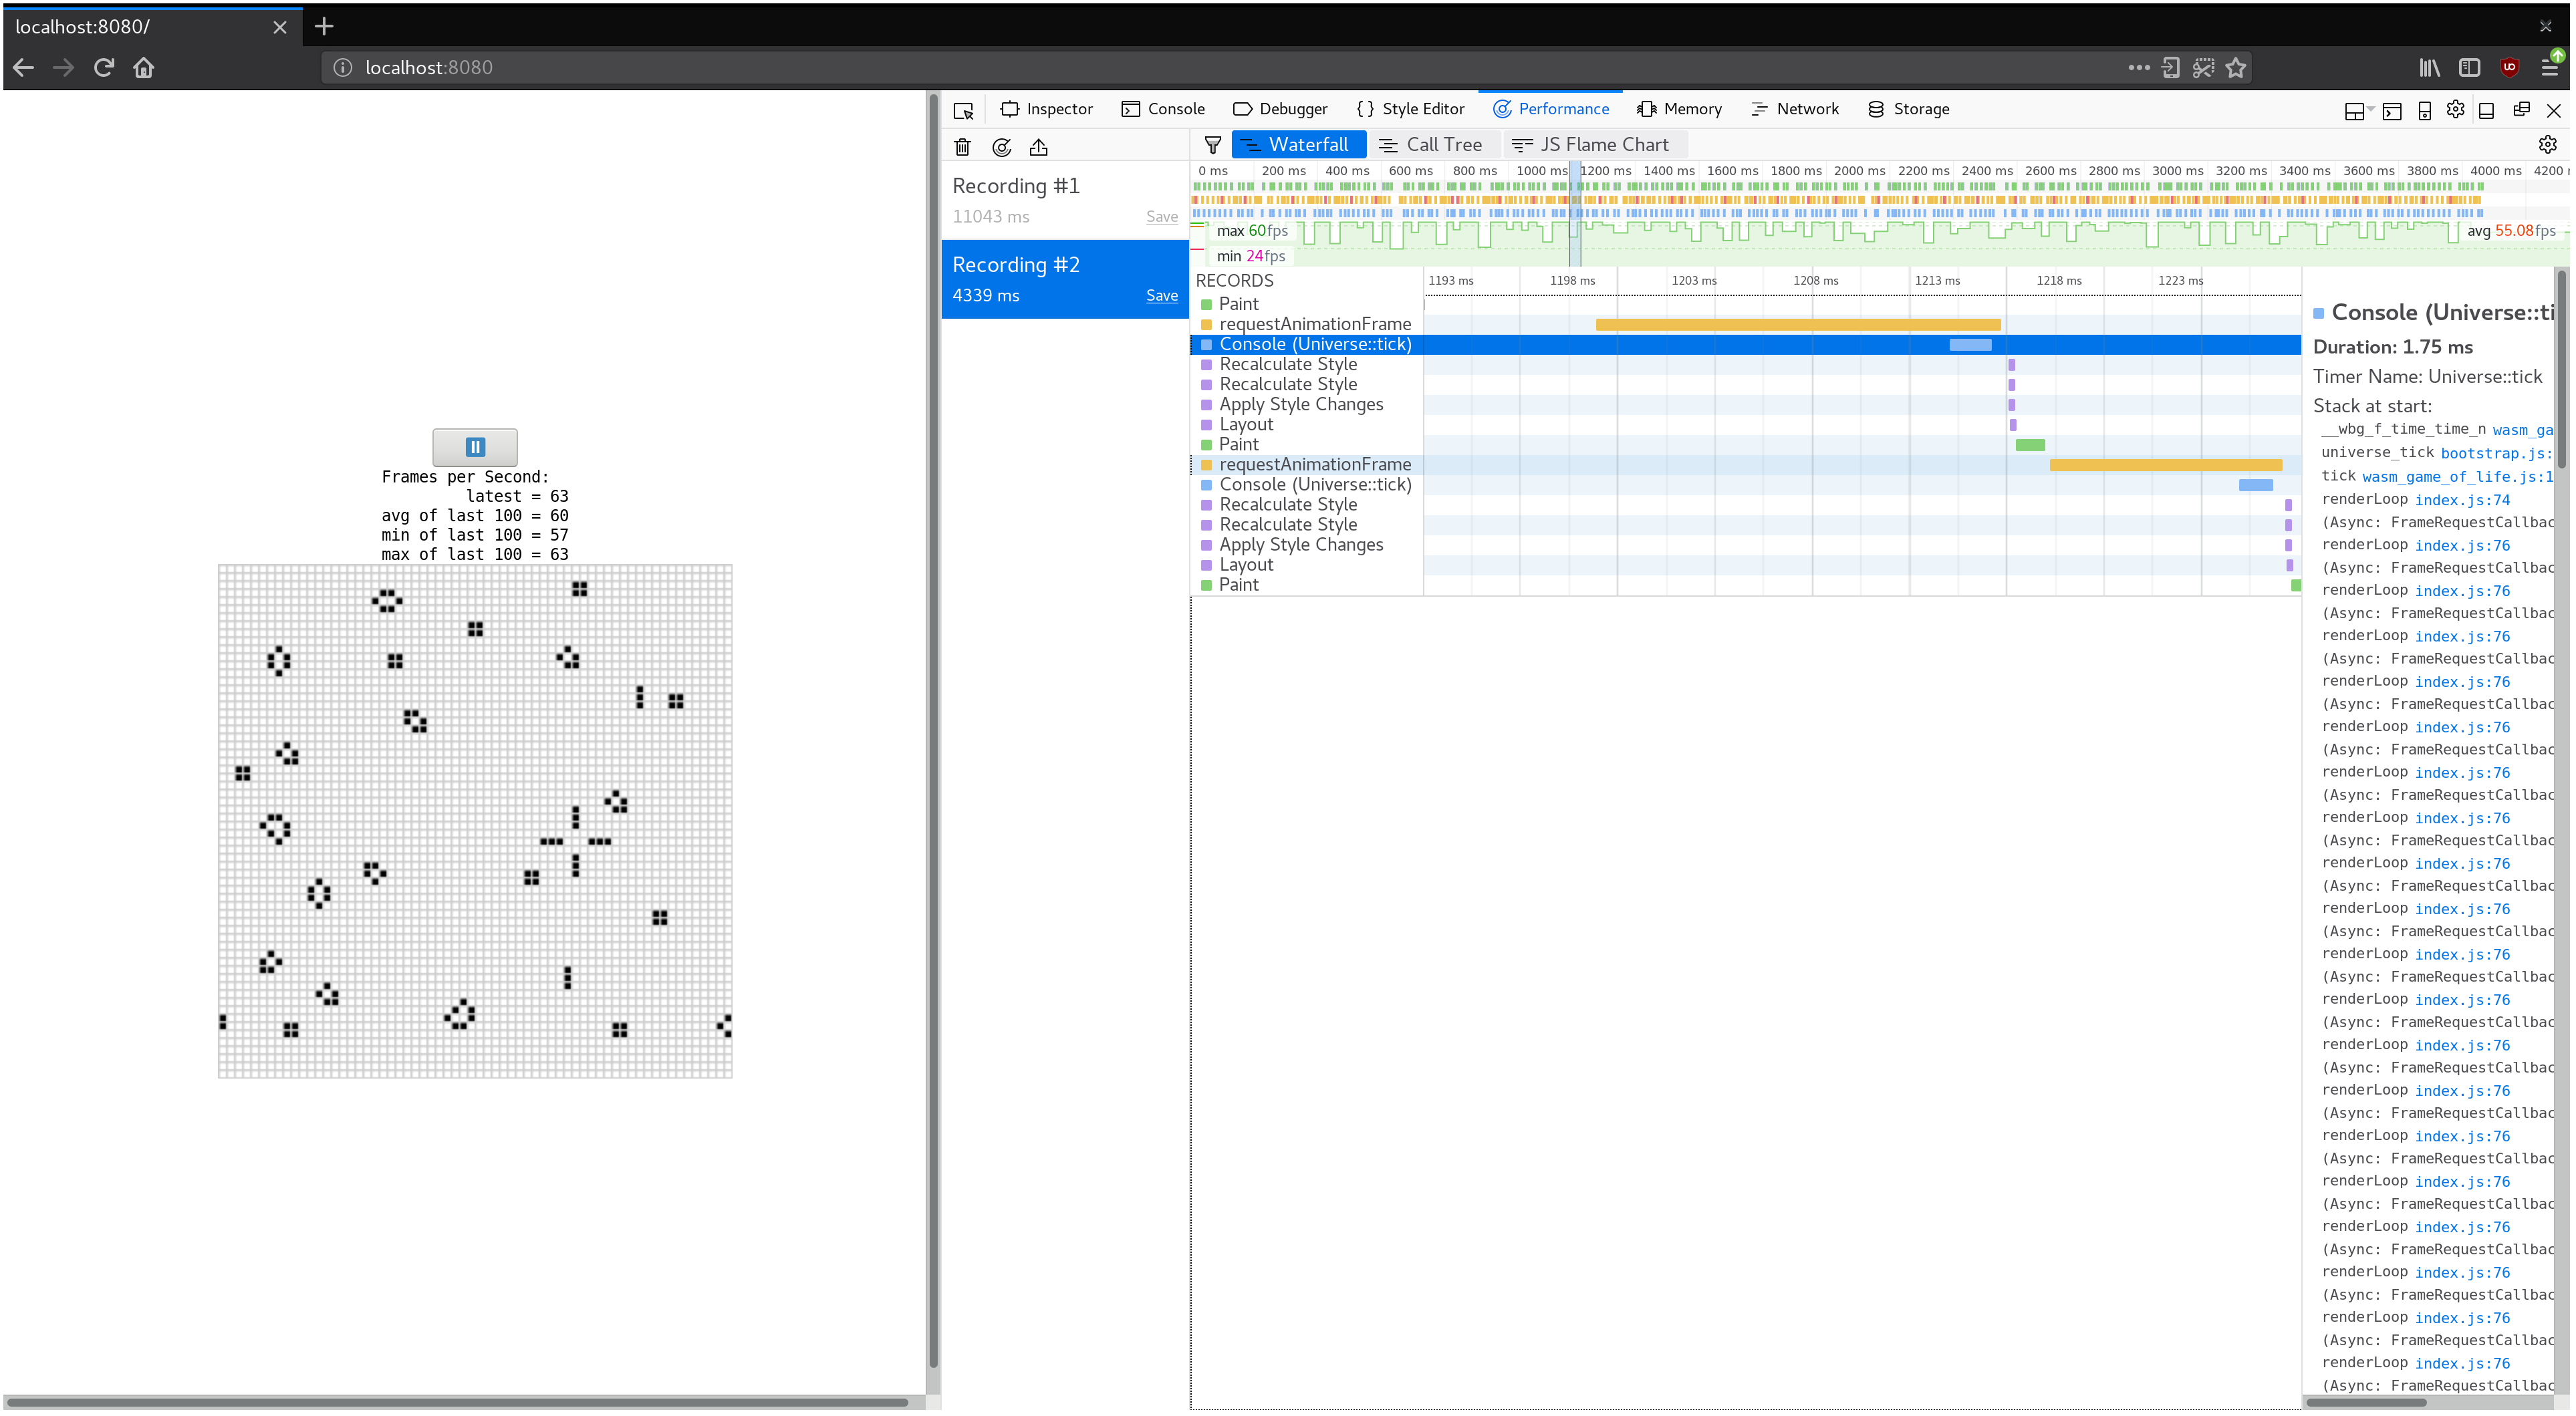
如果我們把 Game of Life Universe 擴大會怎樣?將 64 x 64 Universe 換成 128 x 128 Universe(修改 wasm-game-of-life/src/lib.rs 中的 Universe::new),會讓 FPS 從流暢的 60 降到我的電腦上不流暢的 40 左右。
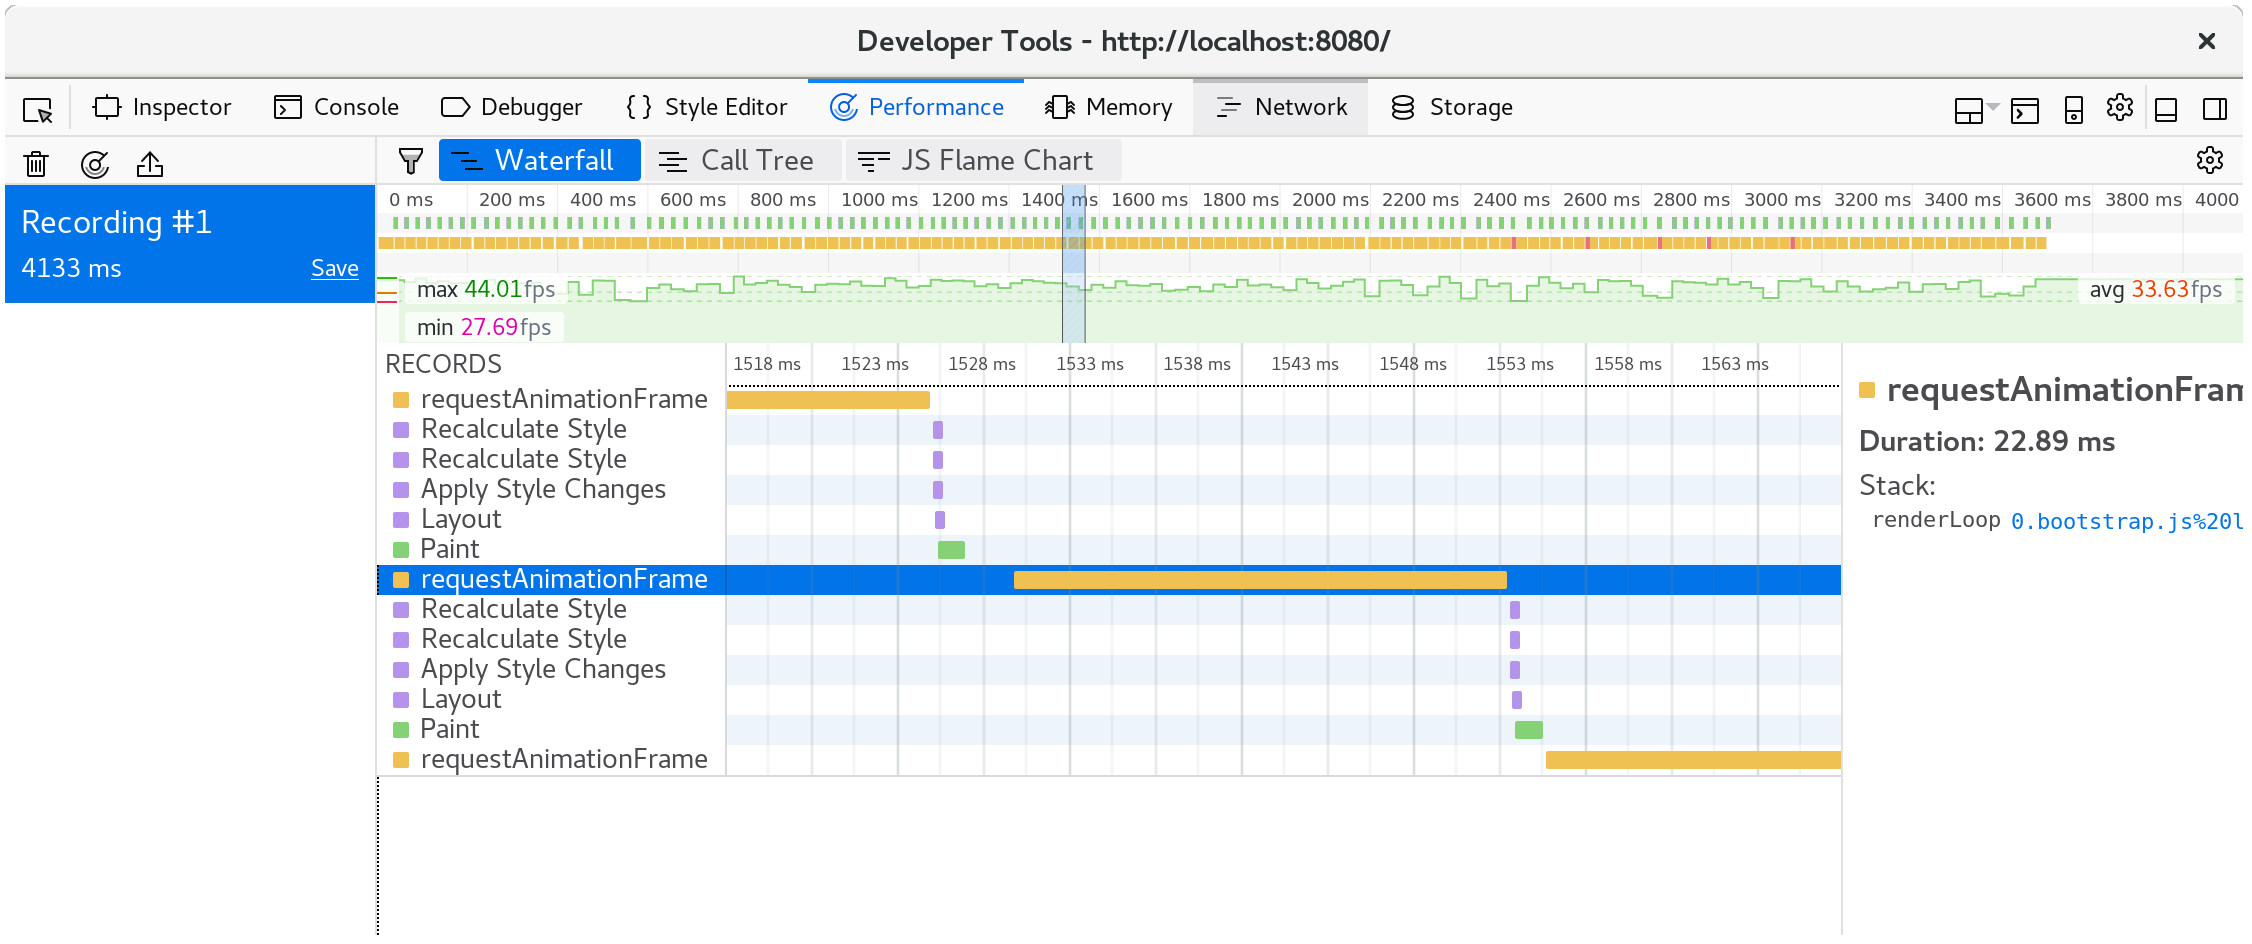
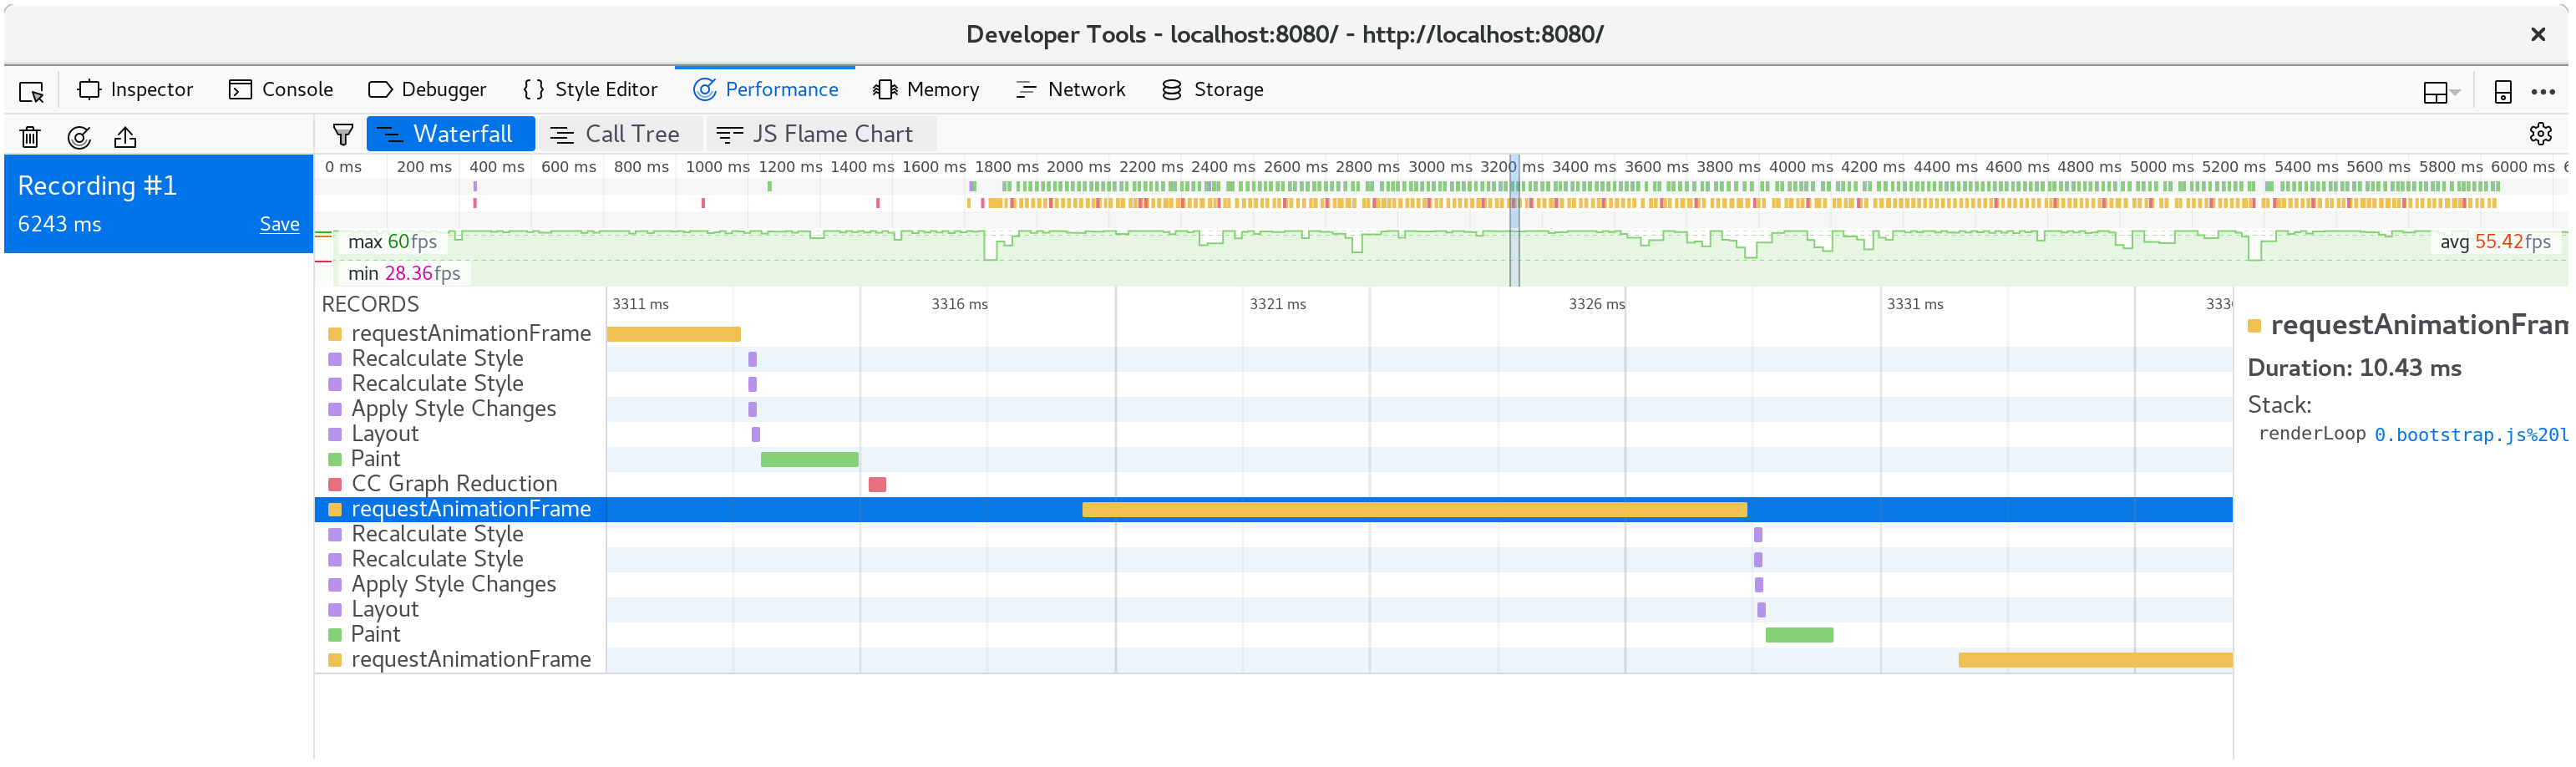
如果我們記錄一個剖析檔並檢視瀑布檢視,我們會看到每個動畫畫格都花費超過 20 毫秒。回憶一下,每秒 60 個畫格會留下 16 毫秒的時間來執行畫格的整個渲染程序。這不只有我們的 JavaScript 和 WebAssembly,還有瀏覽器執行的其他所有作業,例如繪製。
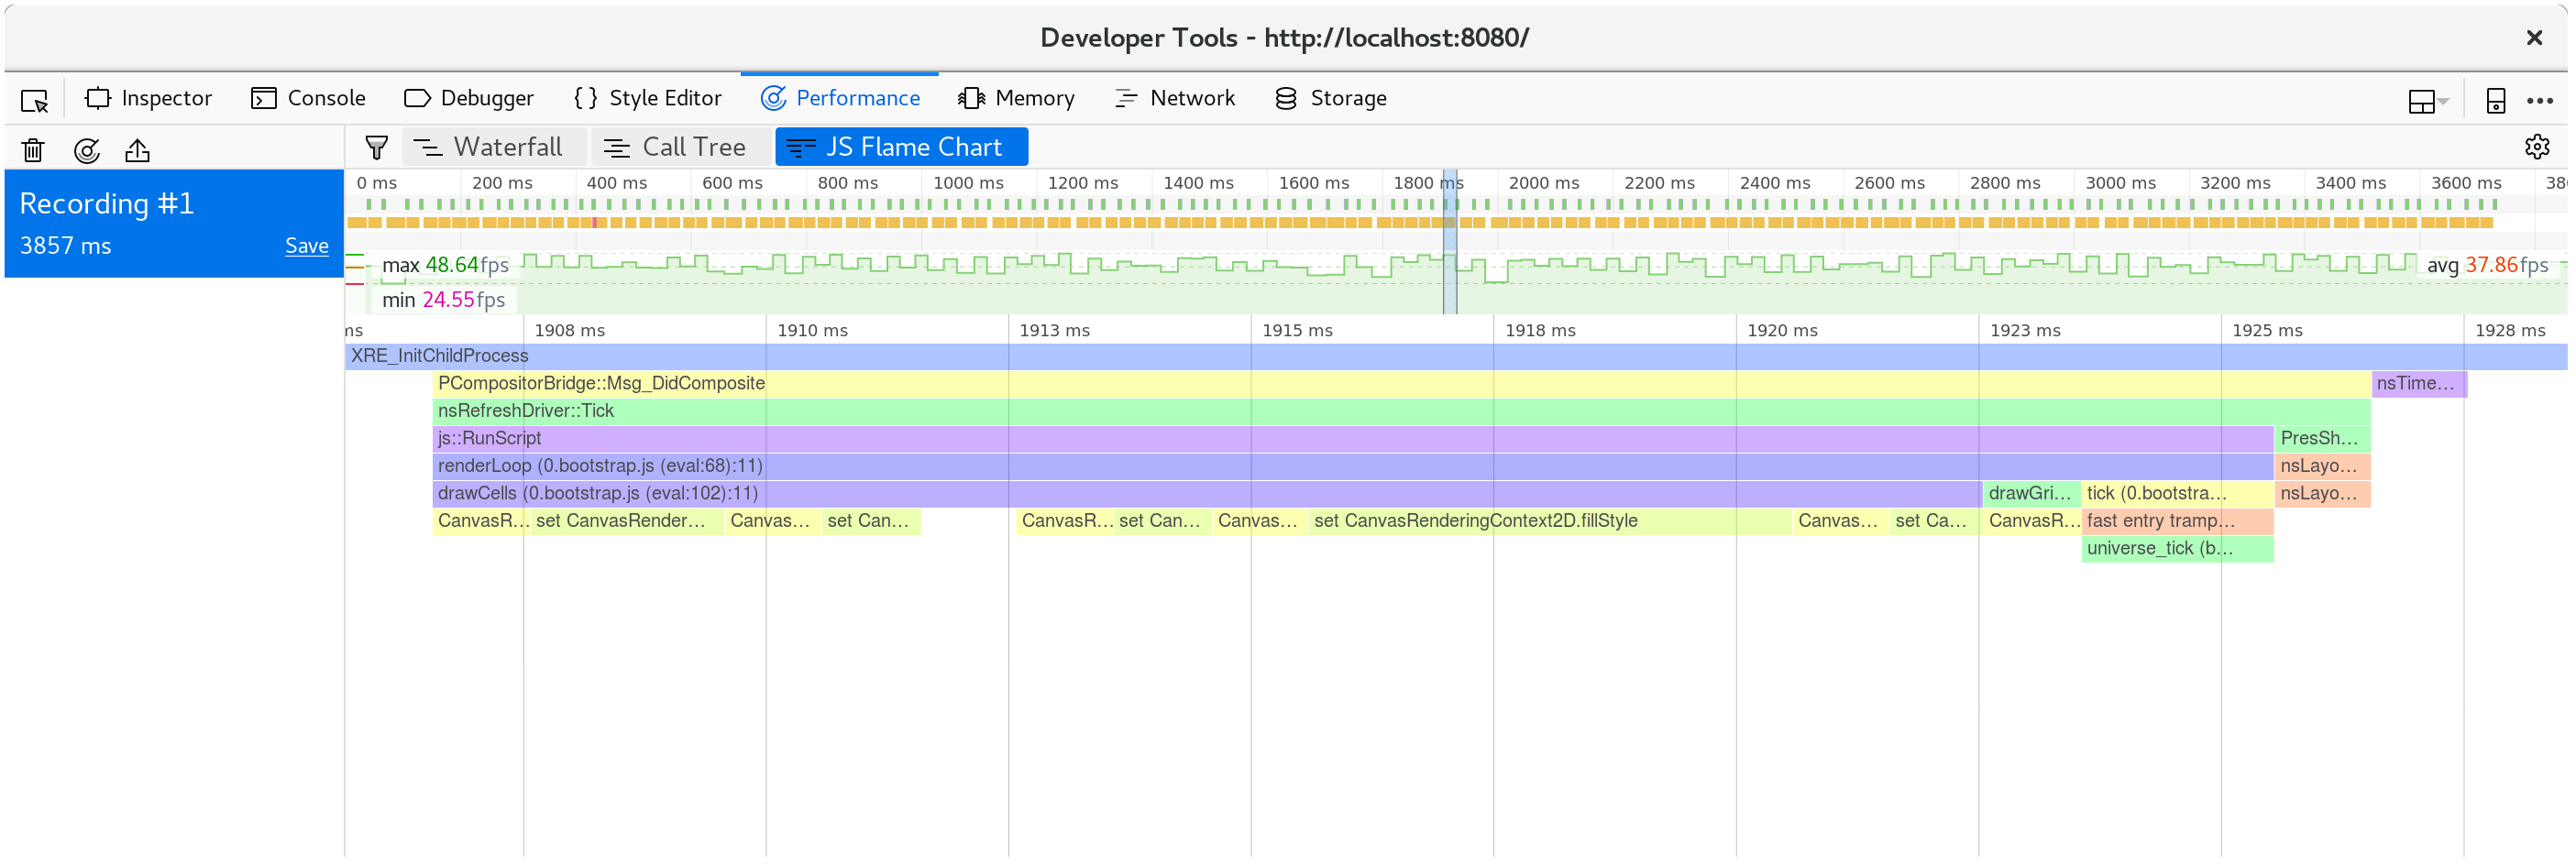
如果我們檢視在單一動畫畫格中發生的事,我們會看到 CanvasRenderingContext2D.fillStyle 設定器非常昂貴!
⚠️ 在 Firefox 中,如果您看到一條只寫「DOM」的線而不是上面提到的
CanvasRenderingContext2D.fillStyle,您可能需要在效能開發者工具選項中開啟「顯示 Gecko 平台資料」的選項
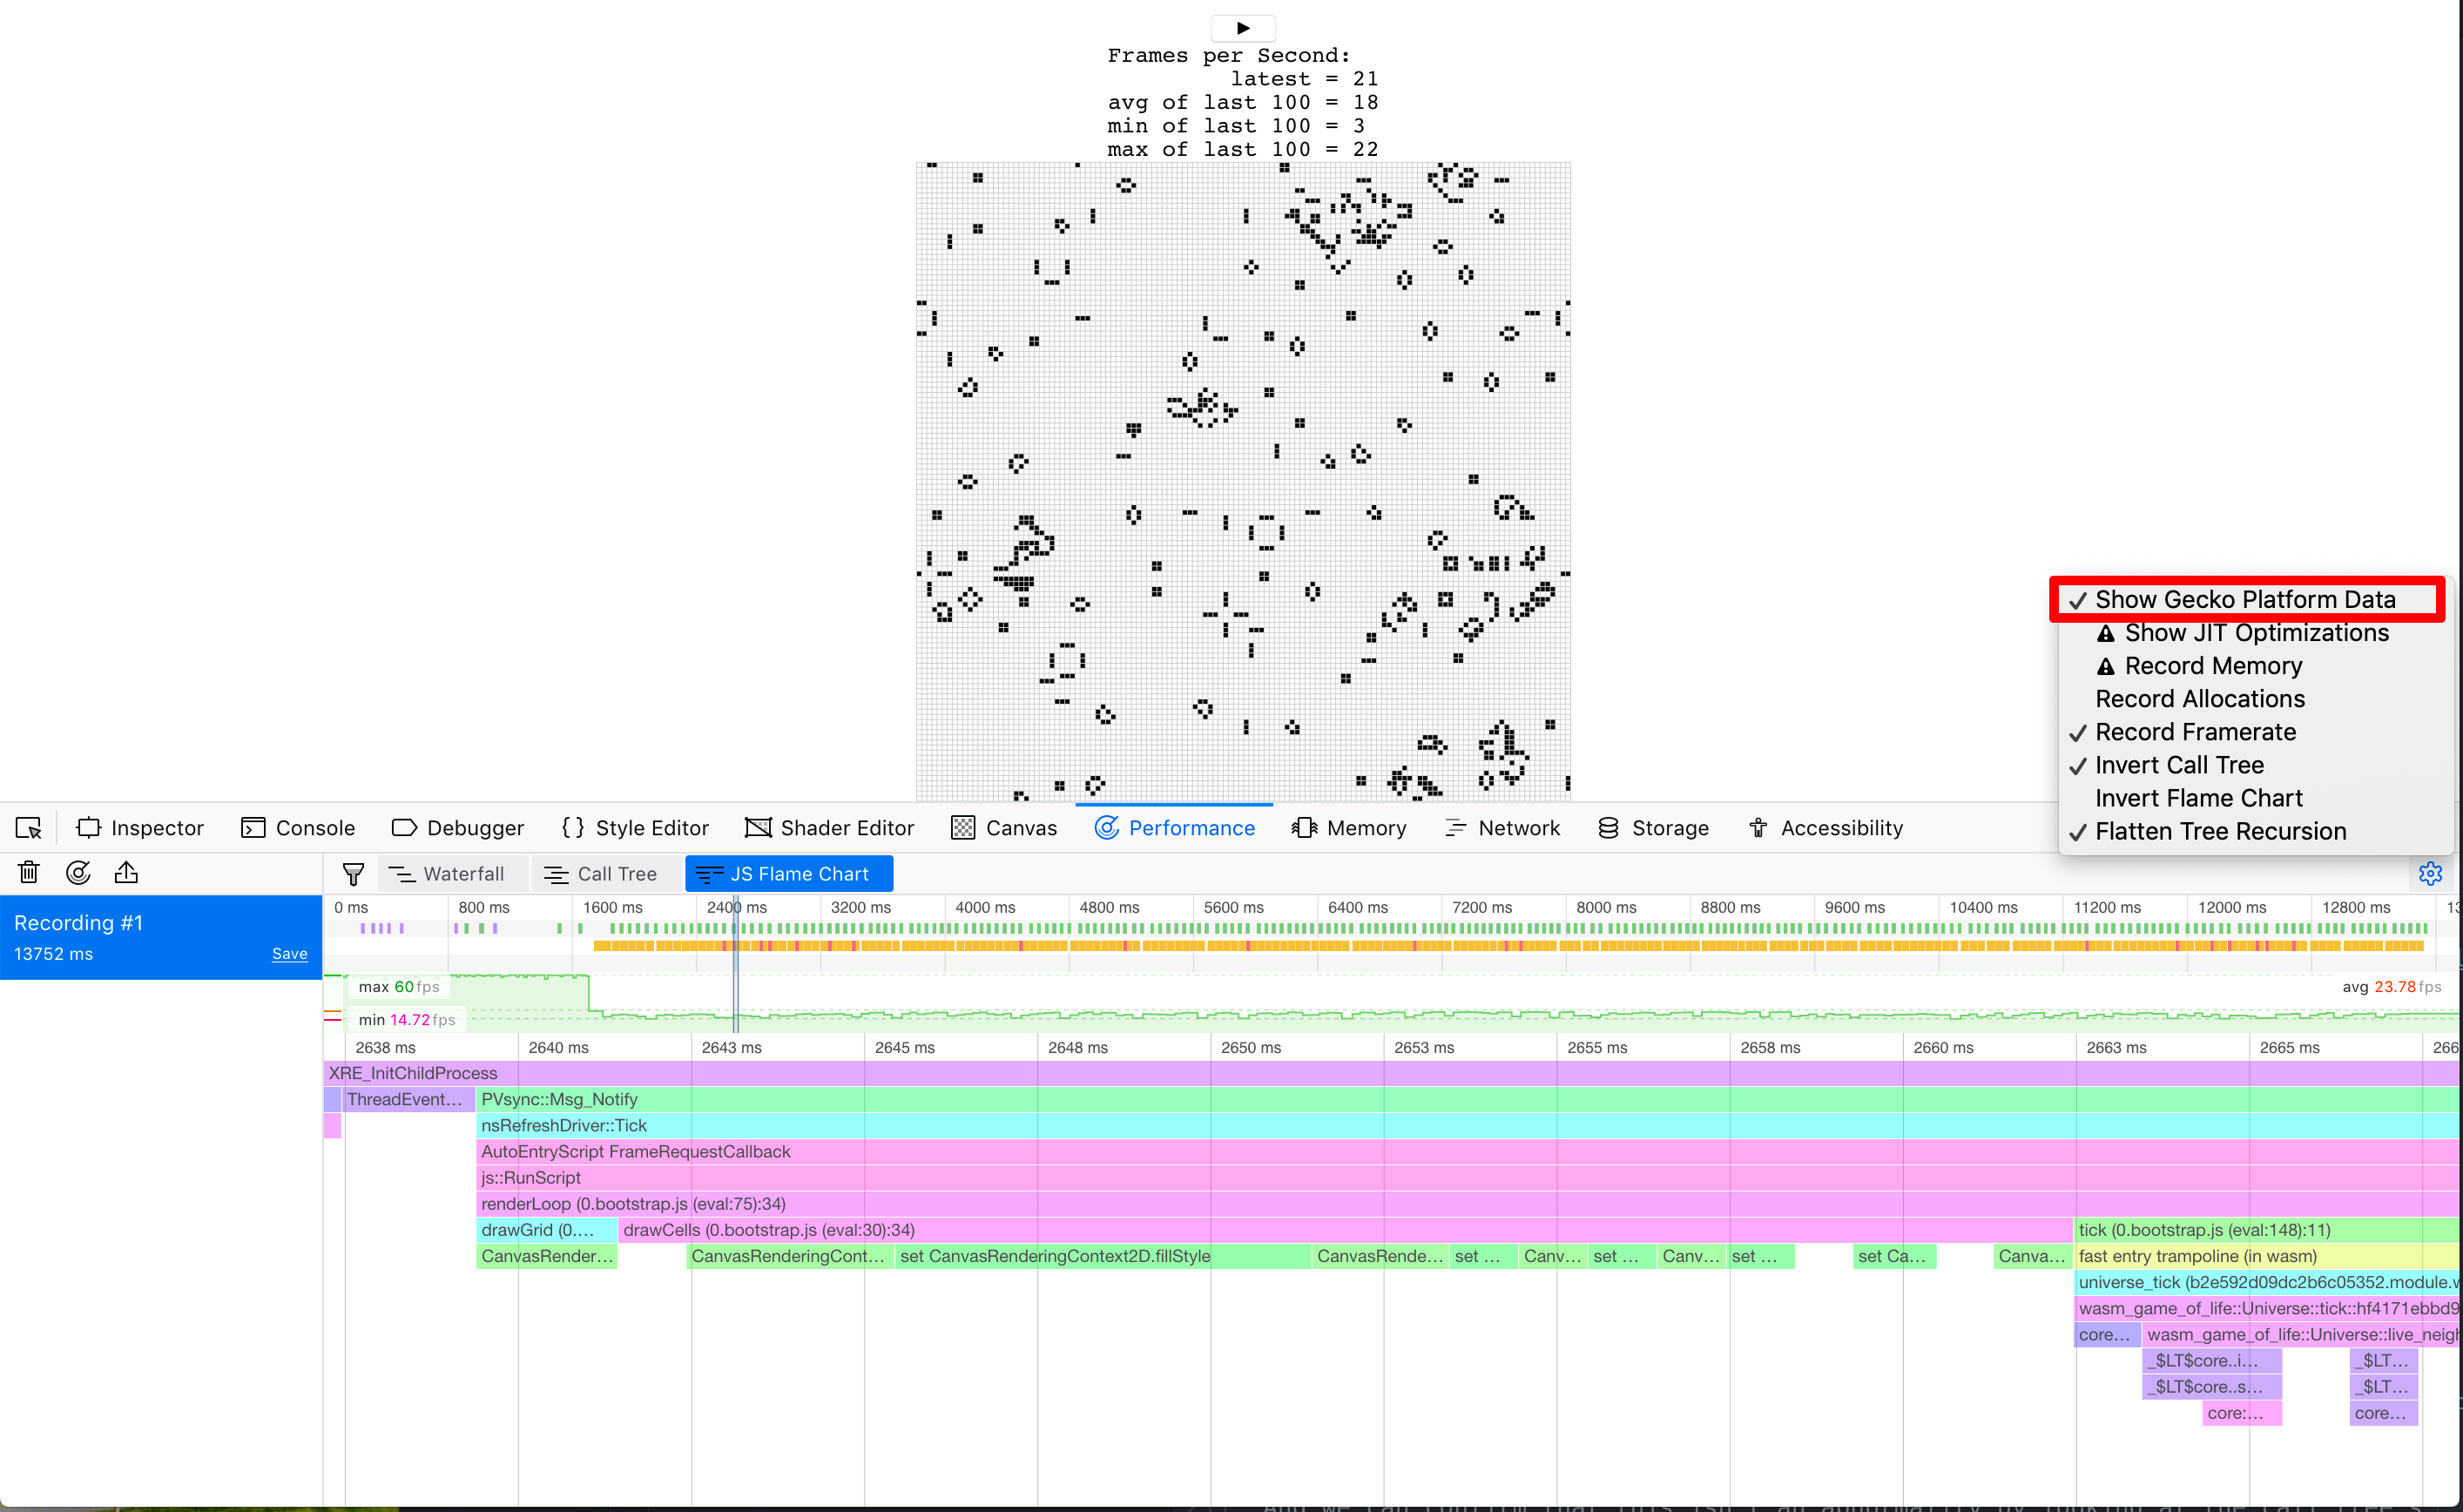
而且從呼叫樹的許多畫格彙總可以確認這並不是異常現象

我們的時間幾乎有 40% 都花費在這個設定器上!
⚡ 我們可能預期
tick方法中的某個東西會成為效能瓶頸,但事實並非如此。永遠讓剖析引導您的關注重點,因為時間可能會花費在您意想不到的地方。
在 wasm-game-of-life/www/index.js 的 drawCells 函式中,fillStyle 屬性會在 Universe 中的每個單元格和每個動畫畫格中設定一次
for (let row = 0; row < height; row++) {
  for (let col = 0; col < width; col++) {
    const idx = getIndex(row, col);

    ctx.fillStyle = cells[idx] === DEAD
      ? DEAD_COLOR
      : ALIVE_COLOR;

    ctx.fillRect(
      col * (CELL_SIZE + 1) + 1,
      row * (CELL_SIZE + 1) + 1,
      CELL_SIZE,
      CELL_SIZE
    );
  }
}
現在我們已經發現設定 fillStyle 的成本很高,我們可以怎麼做避免這麼常設定它呢?我們需要根據單元格是生還是死來變更 fillStyle。如果我們設定 fillStyle = ALIVE_COLOR 然後一次繪製所有活著的單元格,接著設定 fillStyle = DEAD_COLOR 並在另一輪中繪製所有死亡的單元格,那麼我們只能在設定 fillStyle 兩次,而不是每次都設定每個單元格。
// Alive cells.
ctx.fillStyle = ALIVE_COLOR;
for (let row = 0; row < height; row++) {
  for (let col = 0; col < width; col++) {
    const idx = getIndex(row, col);
    if (cells[idx] !== Cell.Alive) {
      continue;
    }

    ctx.fillRect(
      col * (CELL_SIZE + 1) + 1,
      row * (CELL_SIZE + 1) + 1,
      CELL_SIZE,
      CELL_SIZE
    );
  }
}

// Dead cells.
ctx.fillStyle = DEAD_COLOR;
for (let row = 0; row < height; row++) {
  for (let col = 0; col < width; col++) {
    const idx = getIndex(row, col);
    if (cells[idx] !== Cell.Dead) {
      continue;
    }

    ctx.fillRect(
      col * (CELL_SIZE + 1) + 1,
      row * (CELL_SIZE + 1) + 1,
      CELL_SIZE,
      CELL_SIZE
    );
  }
}
儲存這些異動並重新整理 http://localhost:8080/ 後,渲染就恢復到流暢的每秒 60 個畫格。
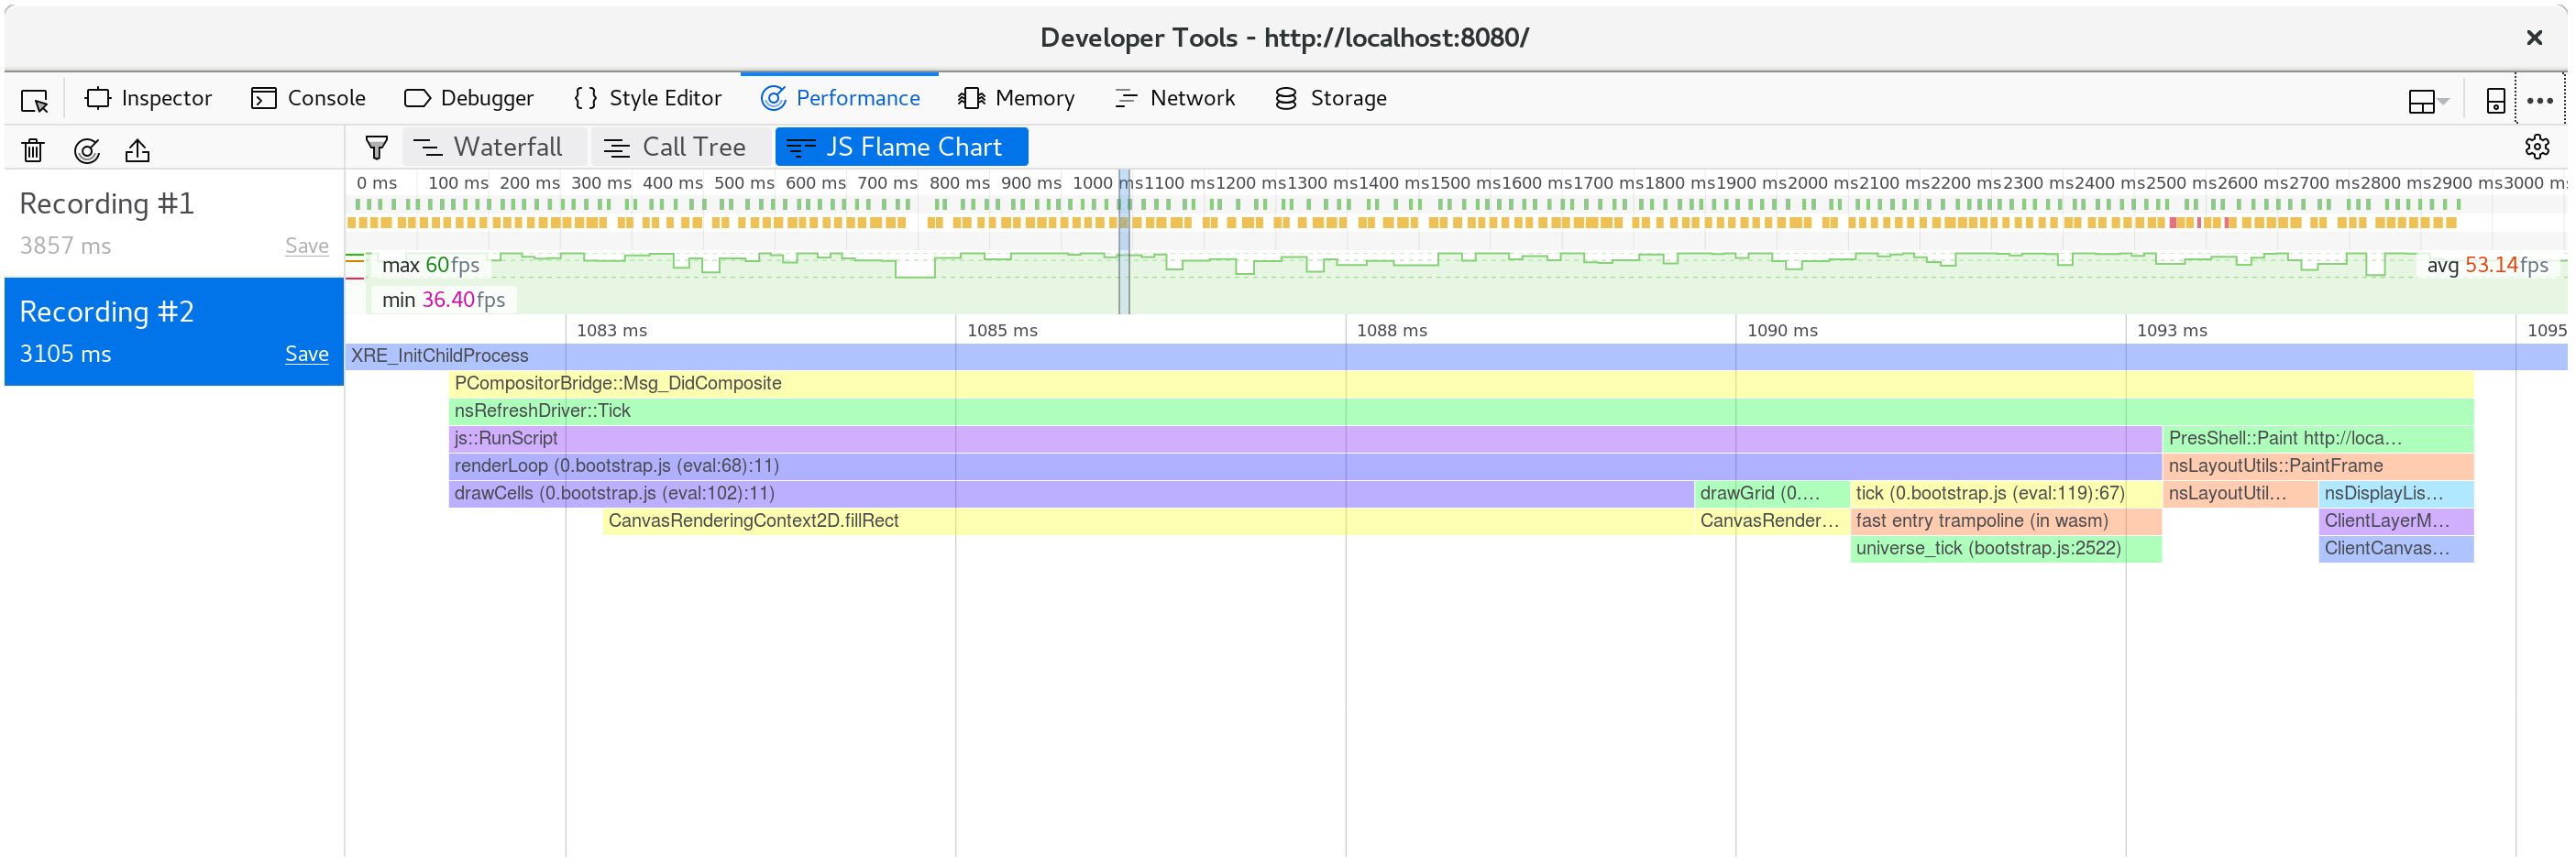
如果我們執行另一個剖析,我們可以發現現在每個動畫畫格只會花費大約 10 毫秒。
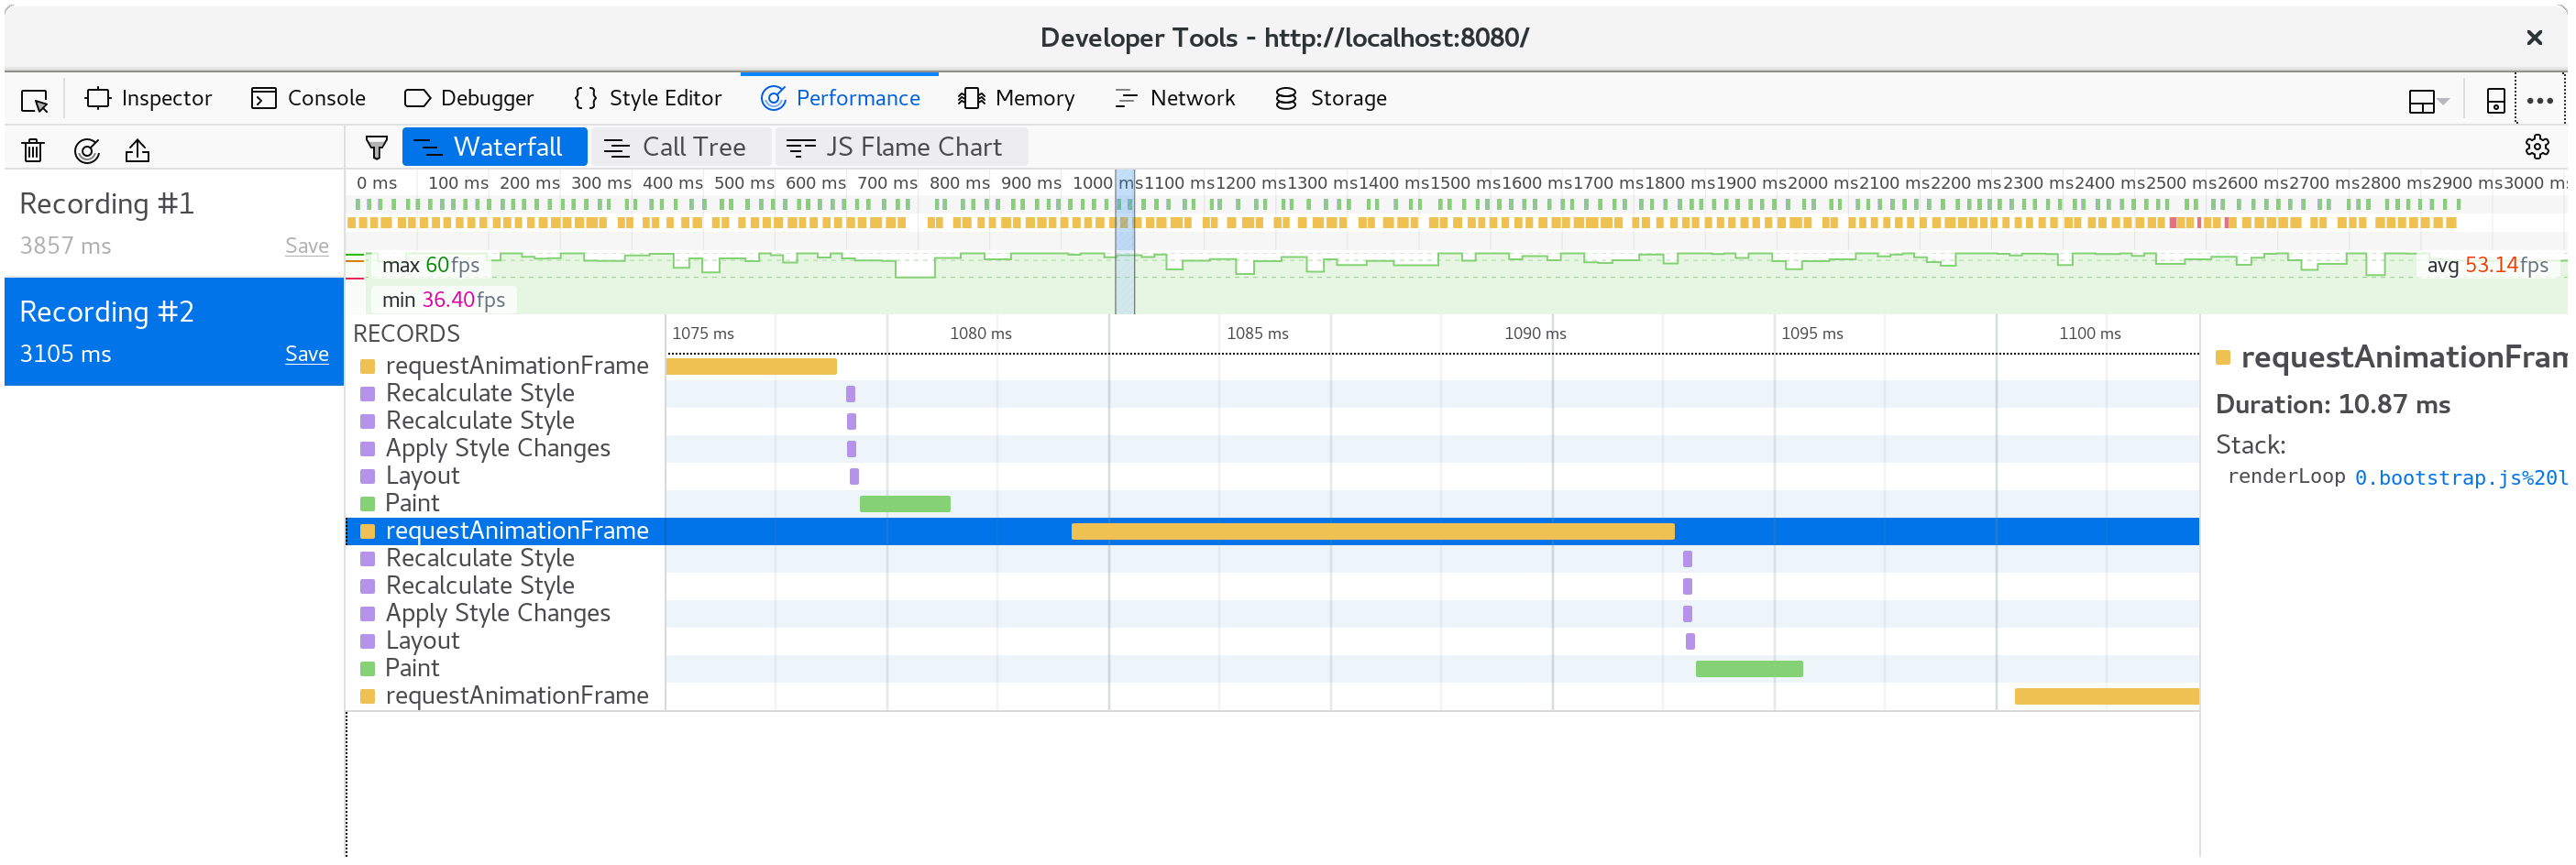
分解單一畫面,我們看到 fillStyle 成本已消失,而且大部分畫面時間用於 fillRect 內,繪製每個儲存格的矩形。
加速時間執行
有些人不喜歡等候時間,而且希望在動畫畫面每發生一次,而不是一次宇宙刻度,會發生九次刻度。我們可以修改 wasm-game-of-life/www/index.js 中的 renderLoop 函式,輕鬆做到這一點。
for (let i = 0; i < 9; i++) {
  universe.tick();
}
在我的電腦上,這讓我們回到每秒只有 35 個畫面的狀態。不夠好。我們想要順暢的每秒 60 個畫面!
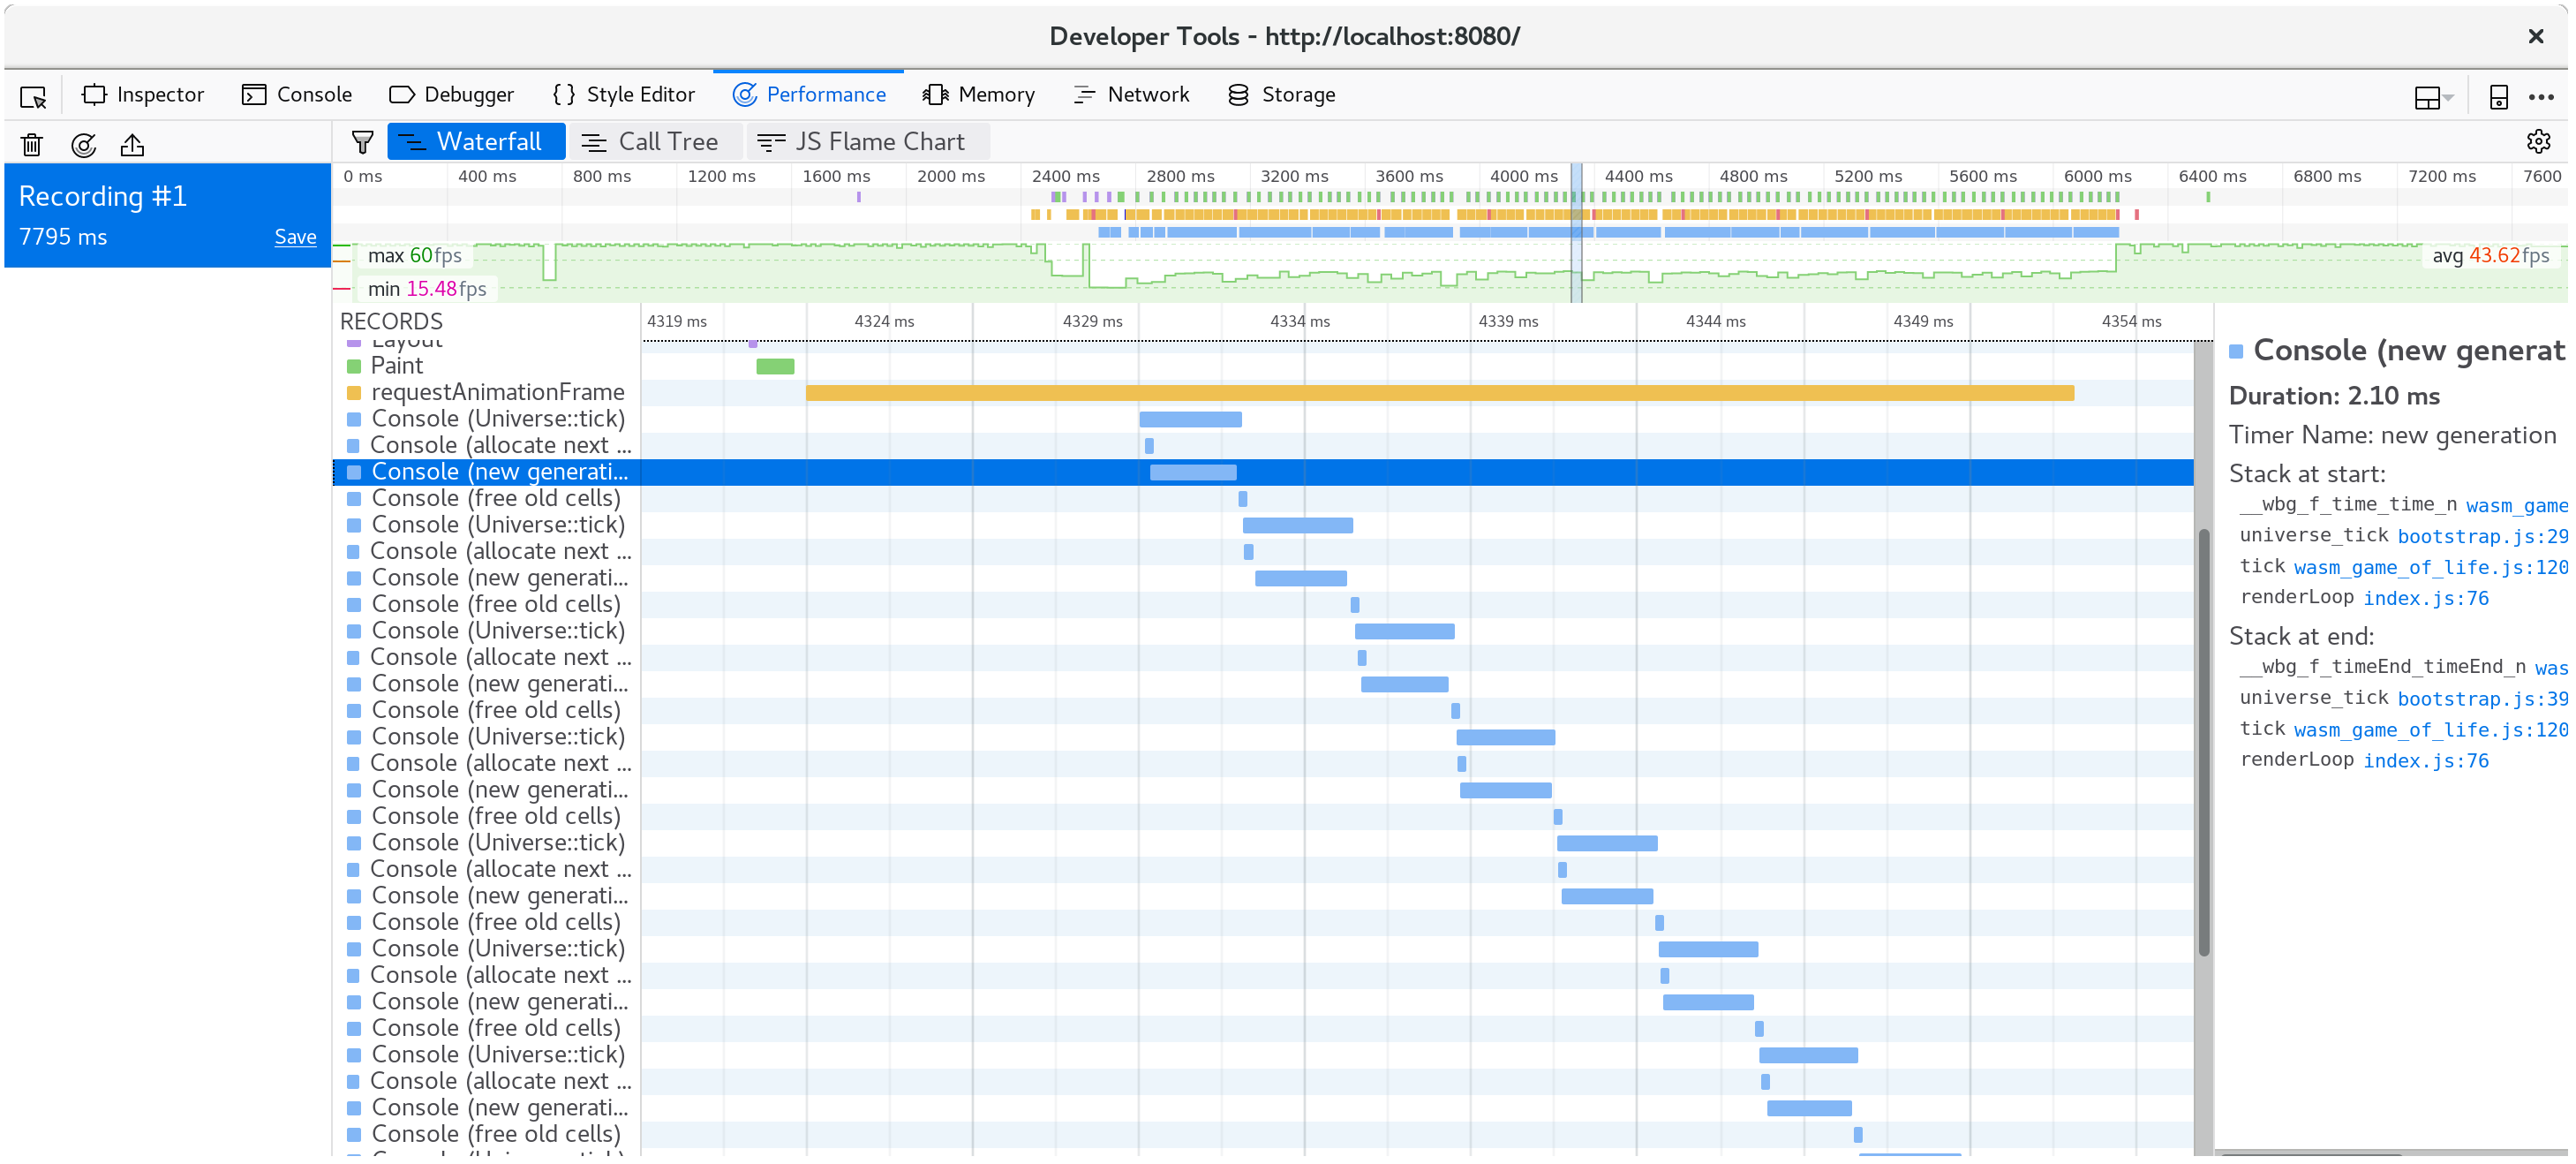
現在我們知道時間是用在 Universe::tick 中,因此我們新增一些 Timer 來在其中封裝各種區段的 console.time 和 console.timeEnd 呼叫,再看看這些呼叫帶我們到哪。我的假設是,在每個刻度配置新的儲存格向量並釋放舊向量成本很高,而且佔用我們大量時間預算。
# #![allow(unused_variables)]
#fn main() {
pub fn tick(&mut self) {
    let _timer = Timer::new("Universe::tick");

    let mut next = {
        let _timer = Timer::new("allocate next cells");
        self.cells.clone()
    };

    {
        let _timer = Timer::new("new generation");
        for row in 0..self.height {
            for col in 0..self.width {
                let idx = self.get_index(row, col);
                let cell = self.cells[idx];
                let live_neighbors = self.live_neighbor_count(row, col);

                let next_cell = match (cell, live_neighbors) {
                    // Rule 1: Any live cell with fewer than two live neighbours
                    // dies, as if caused by underpopulation.
                    (Cell::Alive, x) if x < 2 => Cell::Dead,
                    // Rule 2: Any live cell with two or three live neighbours
                    // lives on to the next generation.
                    (Cell::Alive, 2) | (Cell::Alive, 3) => Cell::Alive,
                    // Rule 3: Any live cell with more than three live
                    // neighbours dies, as if by overpopulation.
                    (Cell::Alive, x) if x > 3 => Cell::Dead,
                    // Rule 4: Any dead cell with exactly three live neighbours
                    // becomes a live cell, as if by reproduction.
                    (Cell::Dead, 3) => Cell::Alive,
                    // All other cells remain in the same state.
                    (otherwise, _) => otherwise,
                };

                next[idx] = next_cell;
            }
        }
    }

    let _timer = Timer::new("free old cells");
    self.cells = next;
}
#}
查看時間,顯然我的假設不正確:大部分時間實際上用於計算下一代儲存格。令人驚訝的是,在每次刻度配置和釋放向量似乎成本微不足道。另一次提醒我們務必透過輪廓分析來引導我們的努力!
下一段落需要 nightly 編譯器。由於我們要針對基準測試使用的 測試功能閘門,因此需要這項編譯器。我們還要安裝的另一個工具是 cargo benchcmp。這是一個用於比較 cargo bench 產生的微基準測試的小型工具。
讓我們撰寫可執行類似於我們的 WebAssembly 動作的原生程式碼 #[bench],但我們可以使用更成熟的輪廓分析工具。這是新的 wasm-game-of-life/benches/bench.rs
# #![allow(unused_variables)]
#![feature(test)]

#fn main() {
extern crate test;
extern crate wasm_game_of_life;

#[bench]
fn universe_ticks(b: &mut test::Bencher) {
    let mut universe = wasm_game_of_life::Universe::new();

    b.iter(|| {
        universe.tick();
    });
}
#}
我們還必須將所有 #[wasm_bindgen] 註解和 Cargo.toml 中的 "cdylib" 位元組註解出來,否則構建原生程式碼就會失敗,而且會有連結錯誤。
所有設定完成後,我們可以執行 cargo bench | tee before.txt 來編譯並執行基準測試!| tee before.txt 部分會取用 cargo bench 的輸出,並放入名為 before.txt 的檔案中。
$ cargo bench | tee before.txt
    Finished release [optimized + debuginfo] target(s) in 0.0 secs
     Running target/release/deps/wasm_game_of_life-91574dfbe2b5a124

running 0 tests

test result: ok. 0 passed; 0 failed; 0 ignored; 0 measured; 0 filtered out

     Running target/release/deps/bench-8474091a05cfa2d9

running 1 test
test universe_ticks ... bench:     664,421 ns/iter (+/- 51,926)

test result: ok. 0 passed; 0 failed; 0 ignored; 1 measured; 0 filtered out
這也會告訴我們二進位檔案存在的位置,我們可以再次執行基準測試,但這次是在作業系統的輪廓分析器之下。就我的情況,我正在執行 Linux,所以 perf 就是我將使用的輪廓分析器
$ perf record -g target/release/deps/bench-8474091a05cfa2d9 --bench
running 1 test
test universe_ticks ... bench:     635,061 ns/iter (+/- 38,764)

test result: ok. 0 passed; 0 failed; 0 ignored; 1 measured; 0 filtered out

[ perf record: Woken up 1 times to write data ]
[ perf record: Captured and wrote 0.178 MB perf.data (2349 samples) ]
使用 perf report 載入輪廓分析,會顯示我們所有時間都用於 Universe::tick,正如我們預期
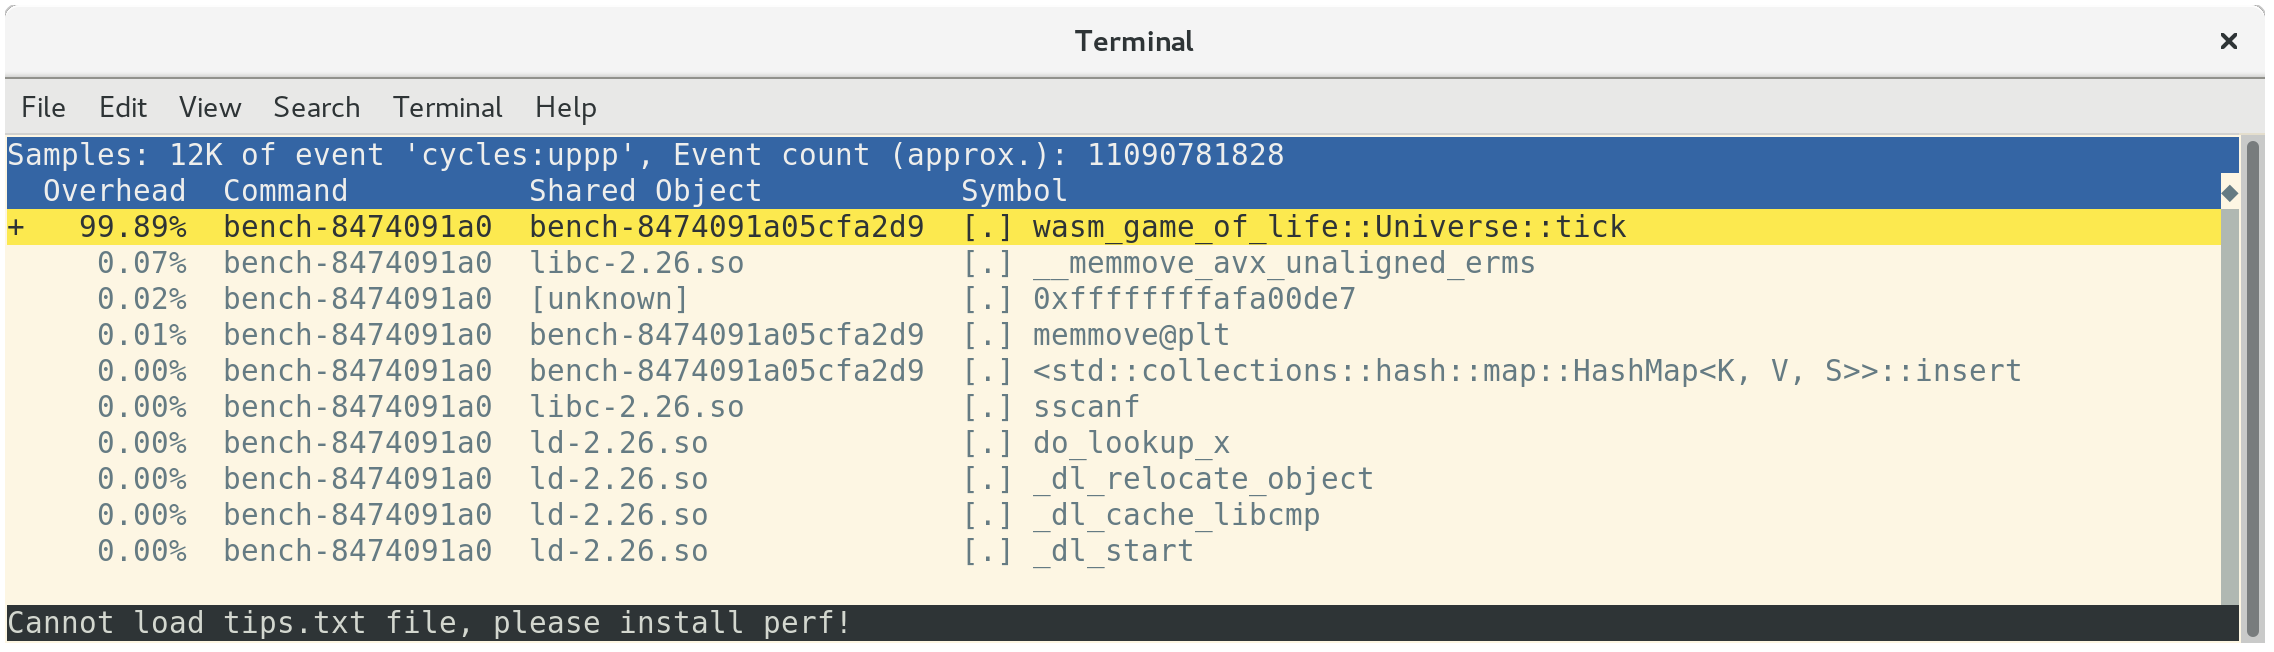
如果你按下 a,perf 會註解函式中用時在哪個指令碼
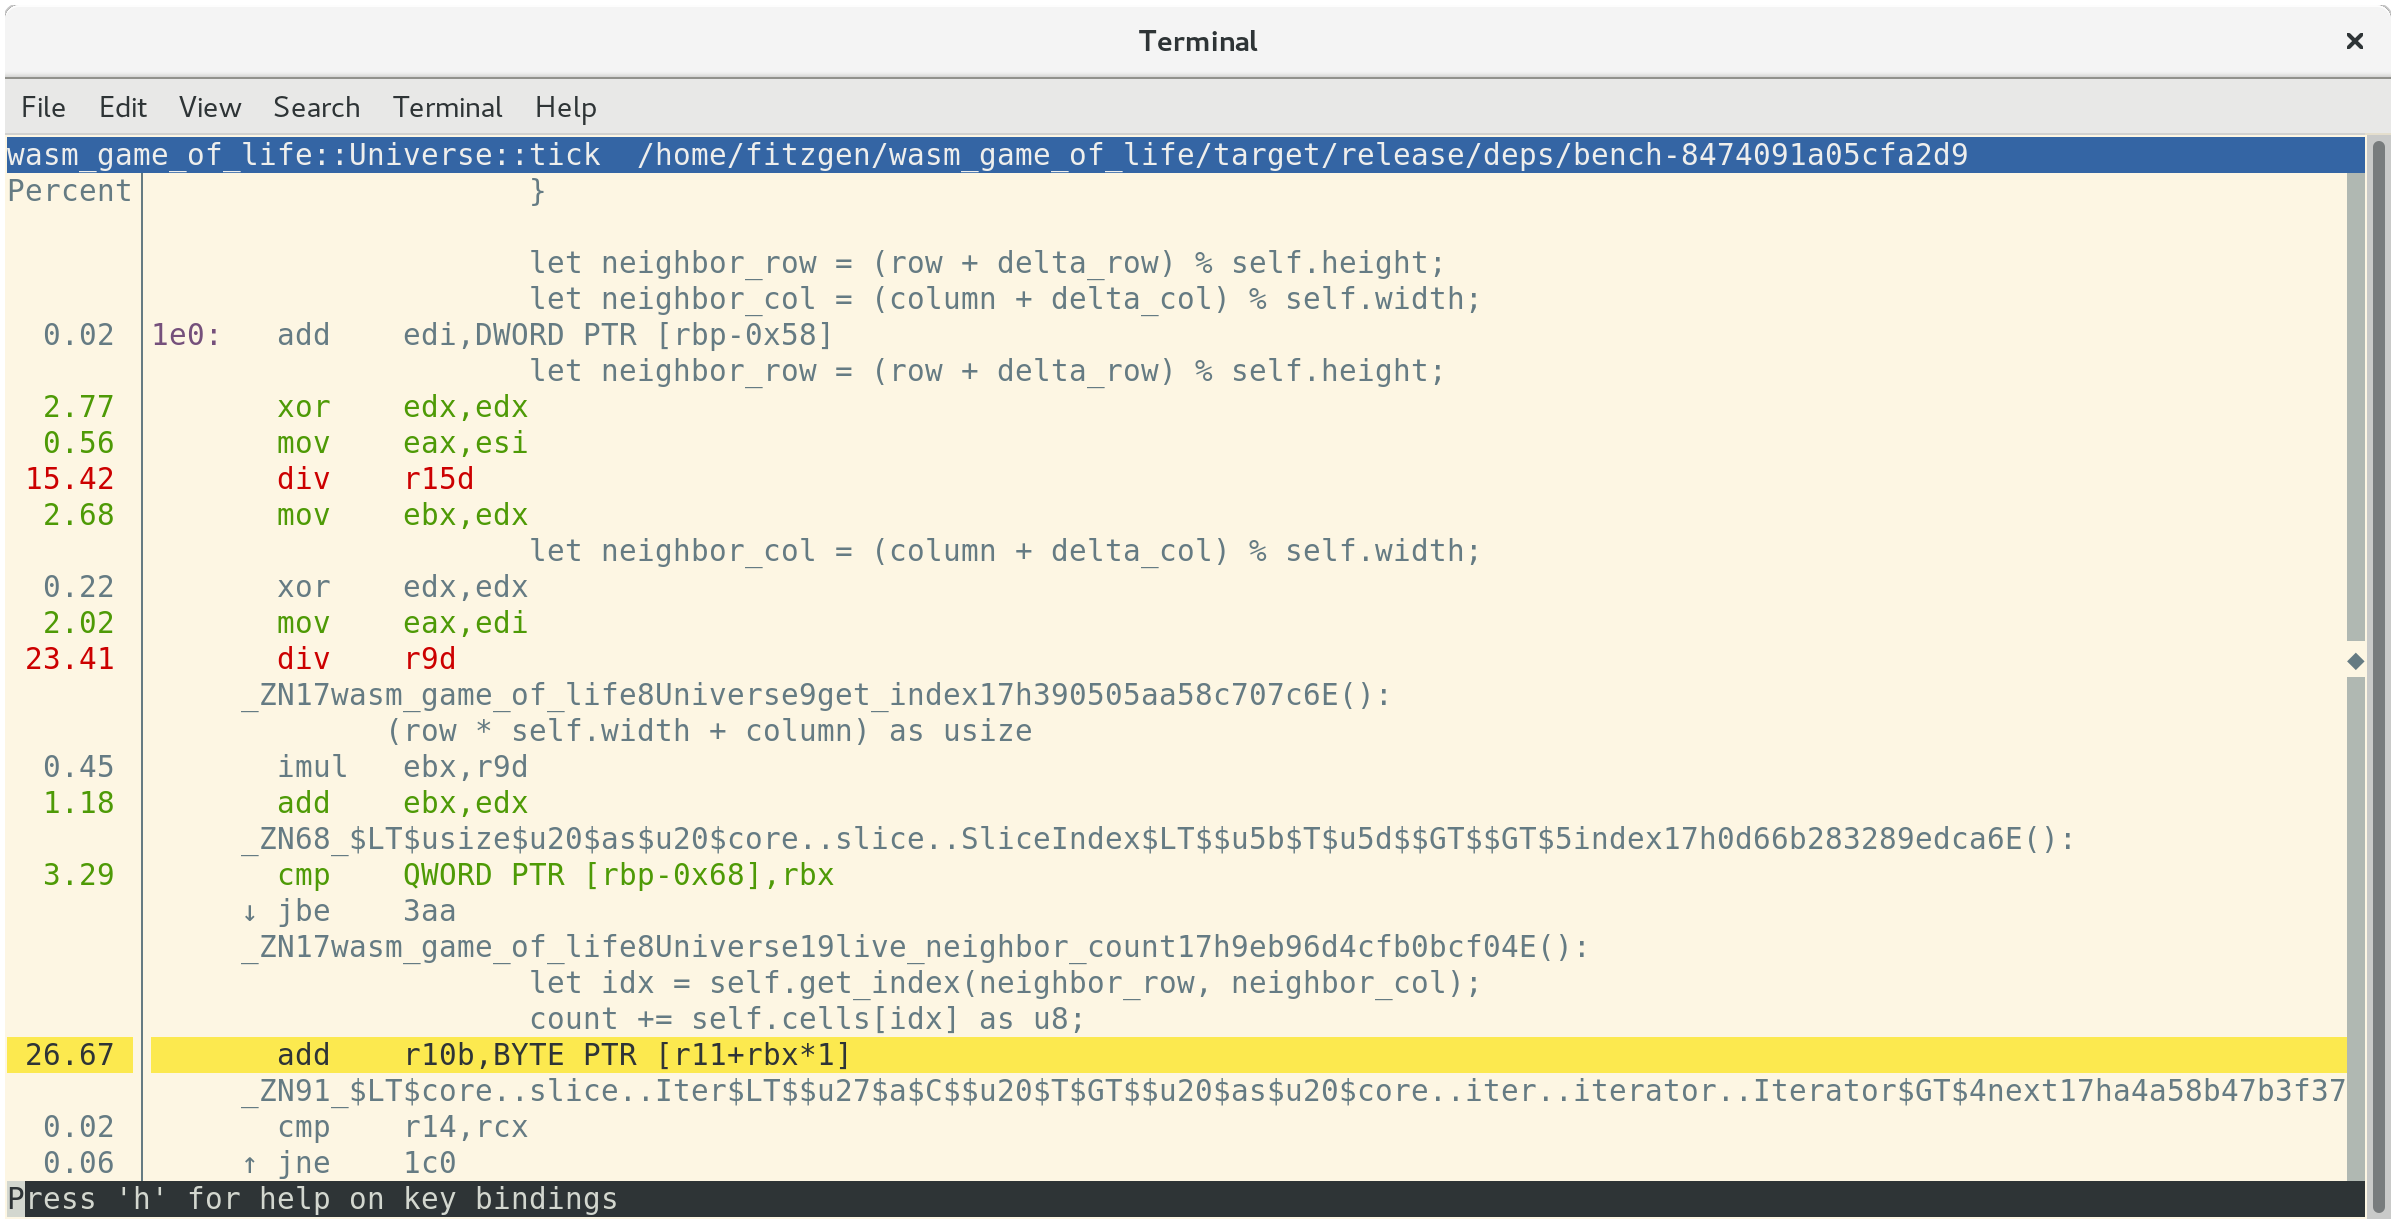
這項資料顯示我們花了 26.67% 的時間來加總鄰近單元的數值、23.41% 的時間用於取得鄰近單元的欄位索引,以及另外 15.42% 的時間用於取得鄰近單元的列索引。在這三個最昂貴的指令中,第二和第三項都是昂貴的 div 指令。這些 div 在 Universe::live_neighbor_count 中實現模組索引邏輯。
回想 wasm-game-of-life/src/lib.rs 內的 live_neighbor_count 定義
# #![allow(unused_variables)]
#fn main() {
fn live_neighbor_count(&self, row: u32, column: u32) -> u8 {
    let mut count = 0;
    for delta_row in [self.height - 1, 0, 1].iter().cloned() {
        for delta_col in [self.width - 1, 0, 1].iter().cloned() {
            if delta_row == 0 && delta_col == 0 {
                continue;
            }

            let neighbor_row = (row + delta_row) % self.height;
            let neighbor_col = (column + delta_col) % self.width;
            let idx = self.get_index(neighbor_row, neighbor_col);
            count += self.cells[idx] as u8;
        }
    }
    count
}
#}
我們使用模組的原因是為了避免在第一或最後一列或欄邊界特例的狀況下,讓程式中充滿 if 分支。但是即使是最常見的情況,也就是 row 或 column 既不在 universe 的邊界上,也不需要模組調整處理,我們仍然必須支付 div 指令的成本。反之,如果我們對邊界特例使用 if,並展開這個迴圈,則 CPU 的分支預測器應該可以非常準確地預測這些分支。
讓我們這樣改寫 live_neighbor_count
# #![allow(unused_variables)]
#fn main() {
fn live_neighbor_count(&self, row: u32, column: u32) -> u8 {
    let mut count = 0;

    let north = if row == 0 {
        self.height - 1
    } else {
        row - 1
    };

    let south = if row == self.height - 1 {
        0
    } else {
        row + 1
    };

    let west = if column == 0 {
        self.width - 1
    } else {
        column - 1
    };

    let east = if column == self.width - 1 {
        0
    } else {
        column + 1
    };

    let nw = self.get_index(north, west);
    count += self.cells[nw] as u8;

    let n = self.get_index(north, column);
    count += self.cells[n] as u8;

    let ne = self.get_index(north, east);
    count += self.cells[ne] as u8;

    let w = self.get_index(row, west);
    count += self.cells[w] as u8;

    let e = self.get_index(row, east);
    count += self.cells[e] as u8;

    let sw = self.get_index(south, west);
    count += self.cells[sw] as u8;

    let s = self.get_index(south, column);
    count += self.cells[s] as u8;

    let se = self.get_index(south, east);
    count += self.cells[se] as u8;

    count
}
#}
現在,讓我們再次執行基準測試!這次將輸出傳送到 after.txt。
$ cargo bench | tee after.txt
   Compiling wasm_game_of_life v0.1.0 (file:///home/fitzgen/wasm_game_of_life)
    Finished release [optimized + debuginfo] target(s) in 0.82 secs
     Running target/release/deps/wasm_game_of_life-91574dfbe2b5a124

running 0 tests

test result: ok. 0 passed; 0 failed; 0 ignored; 0 measured; 0 filtered out

     Running target/release/deps/bench-8474091a05cfa2d9

running 1 test
test universe_ticks ... bench:      87,258 ns/iter (+/- 14,632)

test result: ok. 0 passed; 0 failed; 0 ignored; 1 measured; 0 filtered out
看起來好多了!使用 benchcmp 工具和我們之前建立的兩個文字檔案,我們可以看到它改善了多少
$ cargo benchcmp before.txt after.txt
 name            before.txt ns/iter  after.txt ns/iter  diff ns/iter   diff %  speedup
 universe_ticks  664,421             87,258                 -577,163  -86.87%   x 7.61
哇!速度快了 7.61 倍!
WebAssembly 故意緊密對應於常見的硬體架構,但是我們確實需要確保原生程式碼的這個速度提升也能轉化為 WebAssembly 的速度提升。
我們使用 wasm-pack build 重新建置 .wasm,並重新整理 http://localhost:8080/。在我的電腦上,這個網頁每秒又跑 60 個畫格,而且透過瀏覽器的剖析器再次記錄另一個剖析檔,顯示每個動畫畫格大約需要 10 毫秒。
成功了!
練習
-
在這個階段,為了加速
Universe::tick,下一個最低階的改善方式是移除配置和釋放。實作單元的雙重緩衝,其中Universe維護兩個向量,從來不釋放其中任何一個,而且從來不配置tick中的新緩衝區。 -
在「實作生命」章節中,實作來自替代方案的 delta 式設計,其中 Rust 程式碼會傳回改變狀態的單元清單至 JavaScript。這讓渲染為
<canvas>變得更快了嗎?您可以在每一次刻度上不配置新的 delta 清單的情況下,實作此設計嗎? -
正如我們的剖析結果所顯示的,2D
<canvas>渲染特別慢。將 2D 畫布渲染器替換成 WebGL 渲染器。WebGL 版本快得多嗎?在 WebGL 渲染成為瓶頸之前,您能把宇宙建置得有多大?